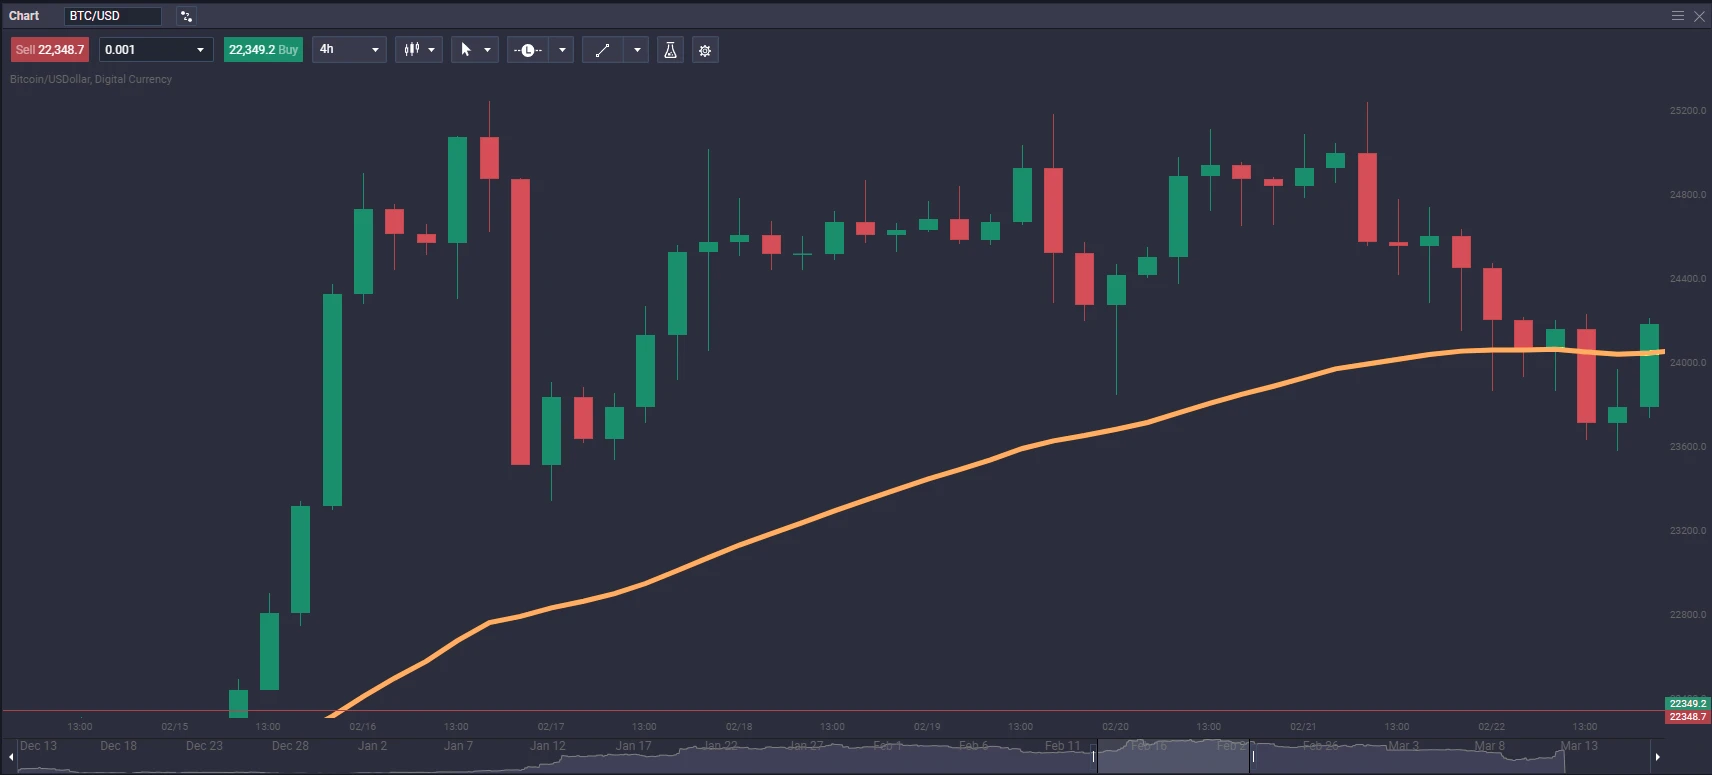
Indicators are powerful tools for technical analysts, with each trader having their preferred set of tools which they select based on their unique trading style. For instance, some traders prefer to follow the market momentum, while others prefer to measure volatility.
There are many technical indicators, but we will only look at the most popular ones: Moving Average (MA), Moving Average Convergence Divergence (MACD) and Relative Strength Index (RSI).
This section provides information on how traders can use some essential technical indicators to gain additional insight into the price action of an asset.
A Moving Average is a trend indicator that smooths out the price action by calculating an average of past price data. The MA is plotted on the price chart, and traders use it to identify the direction of the trend. If the MA slopes upwards, it indicates an uptrend; if it slopes downwards, it indicates a downtrend.
Moving Averages are considered lagging indicators because they are calculated based on historical price data and are, therefore, delayed in responding to changes in the price of an asset.
The most common types of Moving Averages are the Simple Moving Average (SMA or MA) and the Exponential Moving Average (EMA).
The SMA involves producing an average by adding the closing prices of an asset over a set number of periods and then dividing the sum by the number of periods. For example, a 10-day SMA would be the average of the closing prices for the past ten days.
On the other hand, the EMA is calculated by taking the average of a set number of price data points but with more weight given to the most recent data points.
This means the EMA is more responsive to recent price changes and may signal trend changes earlier than the SMA. For instance, if you're looking at a 20-day moving average, the SMA would give equal weight to all 20 days, while the EMA would put more weight on the most recent days. If the asset's price suddenly spikes on day 20, the EMA will be more influenced by that surge than the SMA.
Let's say you're trading Bitcoin on a daily chart, and the price has crossed above the 50-day EMA. This is a bullish signal that suggests the momentum is moving to the upside, and you should consider longing the market. Alternatively, a bearish signal occurs if the price crosses below the 50-day EMA, which suggests that the momentum is shifting to the downside, and opening a short position could be profitable.
Moving Average Convergence Divergence (MACD)
The MACD is a popular indicator used for measuring the momentum and direction of an asset by showing the relationship between two moving averages.
The MACD chart consists of two lines - the MACD line and the signal line. The MACD line is calculated by subtracting the 26-day EMA from the 12-day EMA. A signal line is then created by plotting a 9-day EMA on top of the MACD line.
The MACD indicator generates long and short signals when the MACD line crosses above or below the signal line. For instance, if the plotted MACD line goes above the signal line, the market will likely become bullish as momentum is shifting to the upside. Traders may want to seize the opportunity and open a long position.
In contrast, if the MACD line goes below the signal line, it may be an opportunity to sell as the momentum is shifting to the downside, and the market may become bearish.
Imagine you are trading Bitcoin on a 4-hour chart, and you notice that the MACD line has crossed above the signal line; you can decide to long the market because, as mentioned earlier, this indicator points to an incoming bullish momentum. Alternatively, you can open a short position if the MACD line crosses below the signal line as the market may drop.
The Relative Strength Index, or RSI for short, is another essential technical analysis tool used to measure the strength of an asset's price action.
The RSI indicator compares an asset's average gain and loss over 14 periods. Once this is calculated, the data is then plotted on a scale from 0 to 100. Readings above 70 indicate an overbought condition or a bearish signal, while readings below 30 indicate an oversold condition or a bullish signal. For example, if the asset is on an uptrend, the oversold readings on the RSI could be a potential buying opportunity. But if the asset is on a downtrend, the overbought readings could be a potential selling opportunity for traders.
Traders can also use the RSI indicator to confirm existing trends and potential trend reversals through the so-called bullish and bearish divergences.
A bullish divergence occurs when the RSI and the asset's price are in opposite directions. In other words, the RSI forms a higher low while the price forms a lower low. This suggests that the buying pressure is increasing despite the price drop, and it could be a good opportunity to long the market.
A bearish divergence is when the RSI forms a lower high while the price forms a higher high. This indicates that the selling pressure is increasing, and traders could profit from shorting the market.
Traders can use RSI alongside other indicators to better understand marketing conditions and make more informed trading decisions.


![]()


